Home »
2016 »
January »
24 » the seasonality of gold prices
9:53 PM the seasonality of gold prices |
I recently concentrated on the seasonality of gold prices (see my articles on 19 October, 26 October and 23 November). Today I'll introduce a new search that covers a period of twenty years, from 1996-2015, during which took place a bull market in gold that lasted twelve years, from 2001-2012, surrounded by markets bear in the late 1990s and mid-2010s.
Through a series of standardized graphs, I will show that no matter bullish or bearish the market conditions from one year to the next, some trends of gold prices remain predictable.
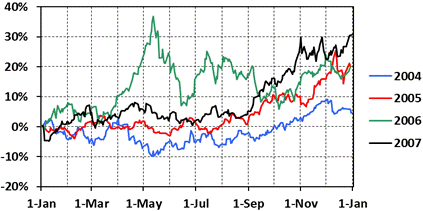
This first series of graphs shows the change in percentage terms the price of gold standard daily January 1 of each year between 1996 and 2015. Note that prices shown are those of the London fixing on the afternoon.


In view of the data presented above, we can define the bullish years (in black) as those in which the price ended the year higher than it began it, and a down year (red) as a year during which the price of gold ended the year lower than it began. In 1998, gold ended the year 40% down; changes in percentage terms is zero
|
|
Views: 514 |
Added by: forex2016
| Rating: 0.0/0 |